Introduction
Data processing and modelling is a major challenge for decision making. The SAP Data Warehouse Cloud (DWC) solution is an innovative choice among the various existing data warehouse tools. Previously featured on this blog, this latest generation tool is regularly updated and features are continually added to make it a true Swiss Army knife of business intelligence while maintaining an intuitive experience.
Focus on the SAP DWC Data Builder, which is at the heart of optimal table and model management.
Presentation of the Data Builder
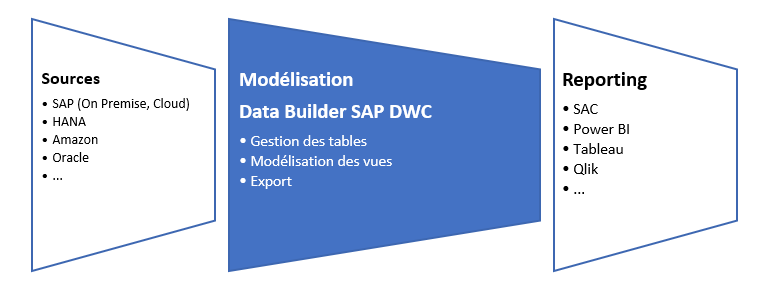
The DAP DWC Data Builder is used to import data sources first (as an import or as remote tables), and to model the data second.
The Data Builder is managed by users within an SAP DWC workspace. Several workspaces can coexist on a SAP DWC tenant (DEV, PROD, etc.). These areas are created and maintained by users with the corresponding roles. The objects contained in the Data Builder are transportable and scalable from one space to another.
The Data Builder is used to process data objects (tables, views, etc.) within a workspace and has functions organised according to the following modelling process :

Subscribe to the Rapid Views Newsletter !
Stay up to date with our latest blog posts, upcoming webinars and news!
Features of the Data Builder
Management of tables in the workspace
Once the data source (S/4 HANA, SAP HANA, SAP BW, etc.) is connected, the first step is to create the tables in the Data Builder, either en masse or individually, which can then be used in the views. SAP DWC offers the possibility to import a table in two formats : remote tables and data flows.
- Remote Table
Remote tables are tables from which only the given metas are imported. The data will be read later, when consulting the downstream report or the data preview. They are imported from the Data Builder home screen using this command , which allows you to access and import objects (tables and views) from the various source directories. By creating a dedicated space containing a set of tables, it is possible to import tables en masse very quickly. Their use requires the installation of a Data Provisioning Agent (DPA), for on-premise systems available at help.sap.com.
- Data flow
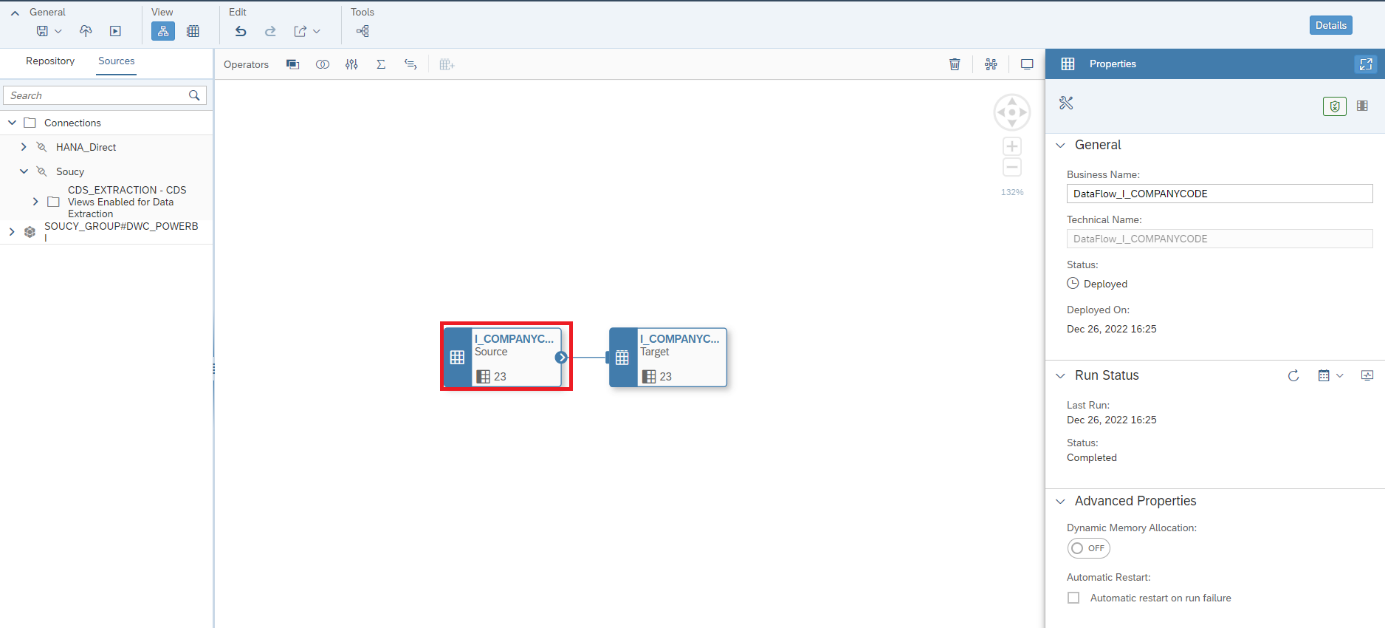
Data flows are tables replicated from the data source, containing the definition and data of the original table. For a data flow to be set up in the Data Builder, the connection of the SAP DWC source must be prepared in the characteristics section :

Setting up a data flow requires the creation of two objects :
The first object (red box) represents the source of the data flow (CDS View or Custom CDS, accessible from the selection pane on the left), the second represents the destination table of the data flow. Many properties of the data flow can be set in the right-hand pane.
View modelling
The construction of modelled views is carried out via the SAP DWC Data Builder. These views are used to cross-reference the data required to produce reports for the decision-making process. They will then contribute to the industrialisation of a decision-making reporting method.
These views offer the user the possibility of manipulating joins between different tables, aggregations and unions, calculated fields and filters, all encapsulated in a semantic layer that is relevant to the end users. The labels (technical and functional names) are read by the final reporting tools such as SAP Analytics, Power BI, Tableau (non-exhaustive list).


Users of the data modeler can choose between a graphical build – low-code build with drag-and-drop – and a scripted build using SQL.
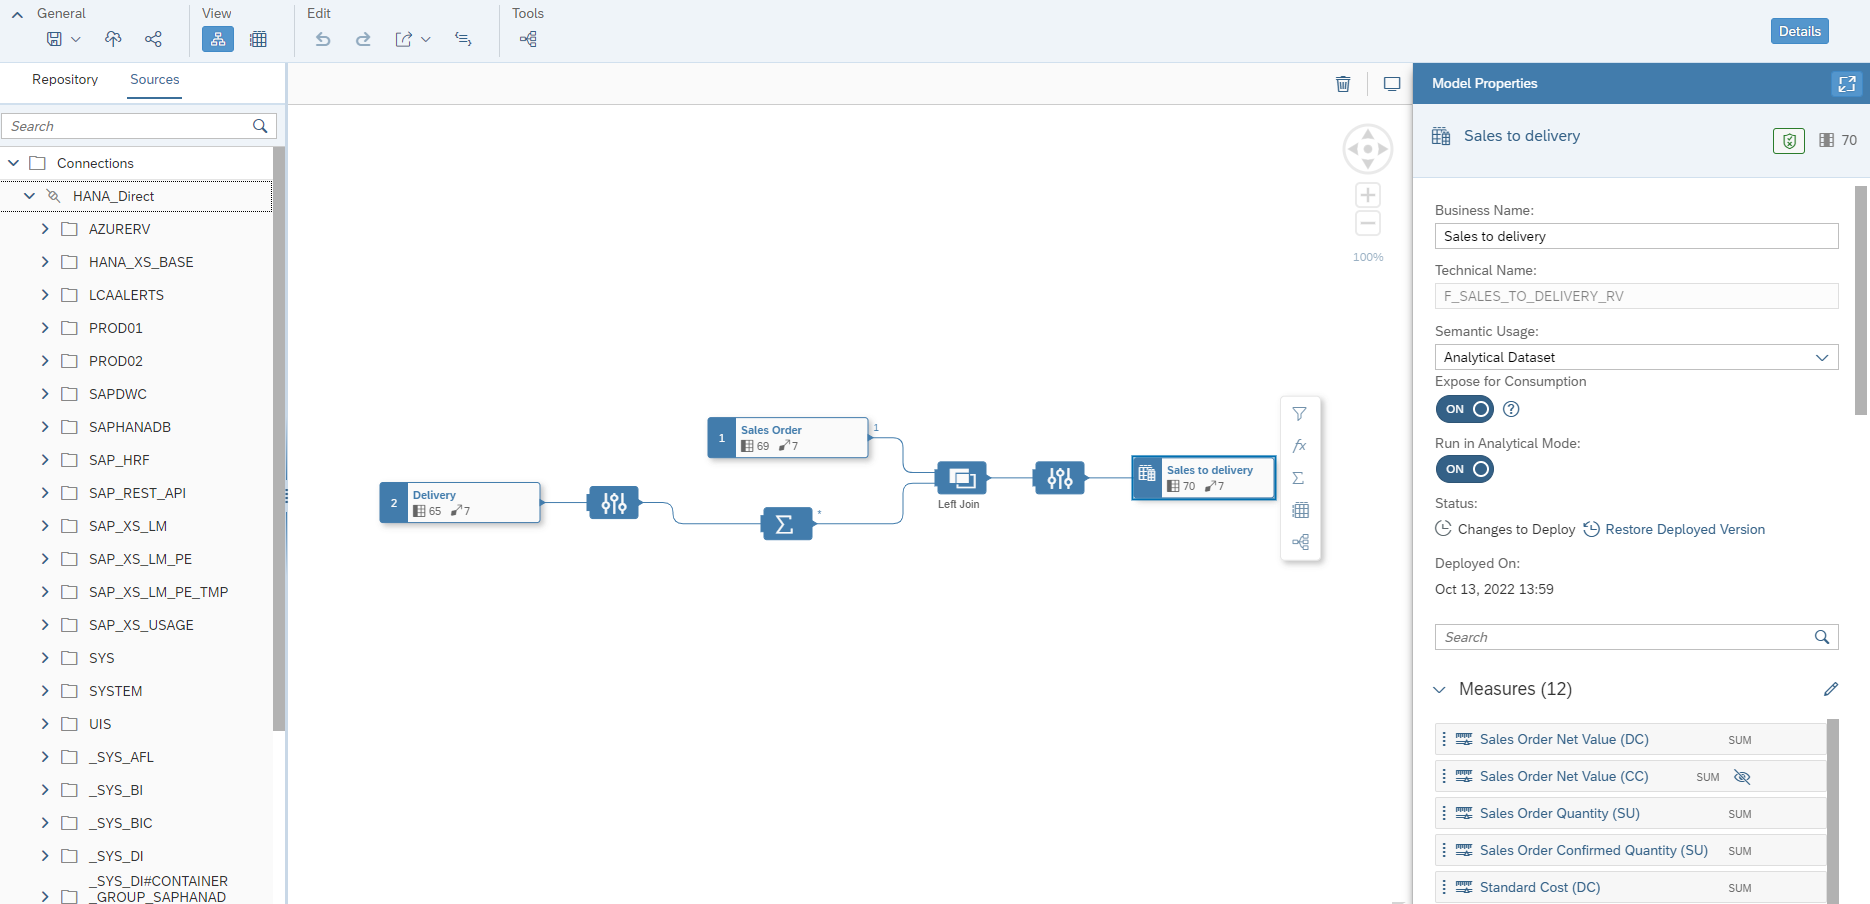
The graphical view shown below, for example, has used the following resources in its construction :
- Two sources, drag-and-dropped from the left pane : the Delivery and Sales Order views
- The Delivery view is then encapsulated in a projection (
) which allows you to transform certain data: hide fields, filter data, add calculated fields. It is possible to observe the result thanks to a data preview.
- This projection is then encapsulated in an aggregation (
) which it is possible to sum the measures according to the attributes retained in the aggregation.
- The two views are then crossed within a left join (
) which allows the selection of the key fields to be mapped.
- This data can then be manipulated in a projection or aggregation.
- The last object of the model is the semantic layer (
) which can be parameterised: labels, attributes or measures, hidden fields, associations, view options, etc. The associations allow a de facto view to be linked to the dimensions in order to create a datamart.
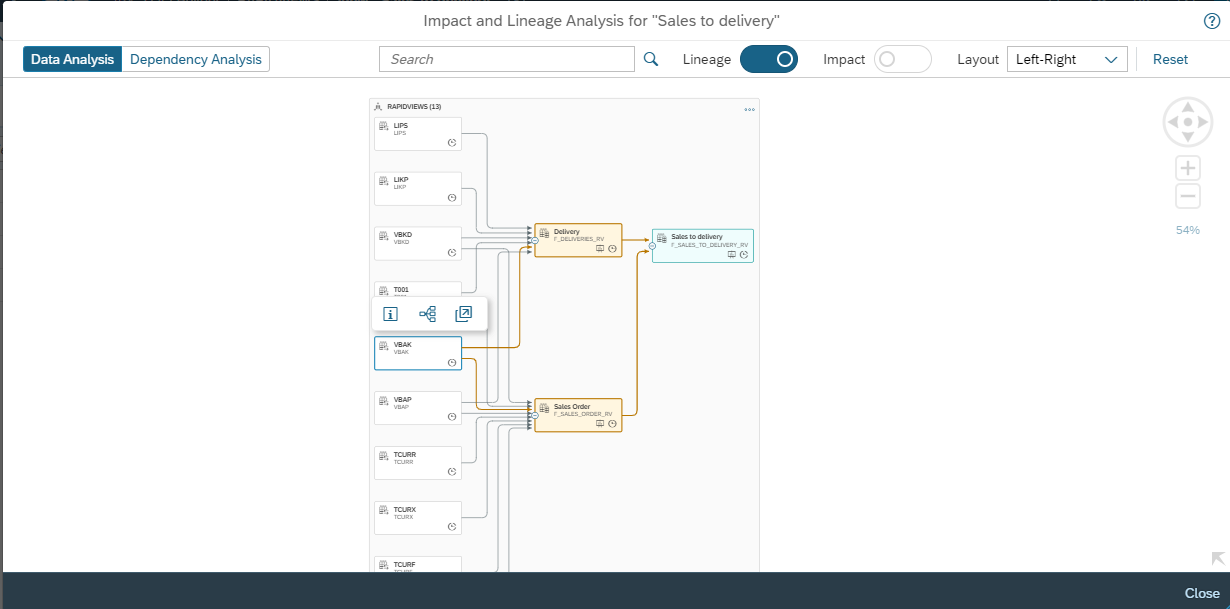
Two other features offer data lineage analysis and impact analysis at field or table level :
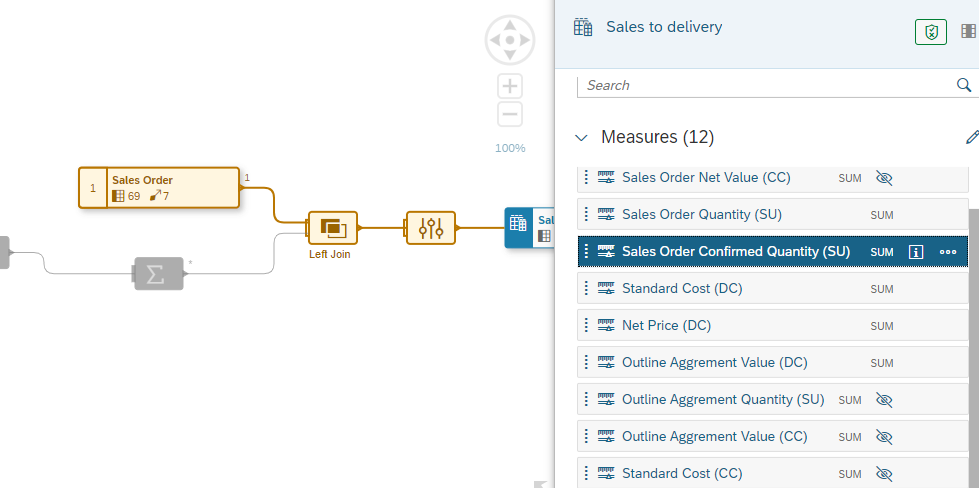
A dedicated blog post deals in detail with the subject of building graphical views on a case study of the FI-CO module.
Entity Relationships Models
Following the data builder’s modelling process, after importing tables and designing analysis views, the user has the option to integrate them into a relational model.
E/R models are graphical descriptions of the relationships between previously built models – tables and views – that form a subset.
Designed to enhance the user experience, E/R models are very useful for providing a global view of the tables and views developed in the space. The E/R model bridges the gap between designers and business users. On the one hand, the designer can directly modify elements of the entities that make up the E/R model: deploying the E/R model activates all the modifications carried out on the views of the E/R model in cascade. It will be more efficient to work directly on this model to perform modifications on several views. On the other hand, the designer will share these models with end users who will have a preview of the table and view layout as a source for their reports.
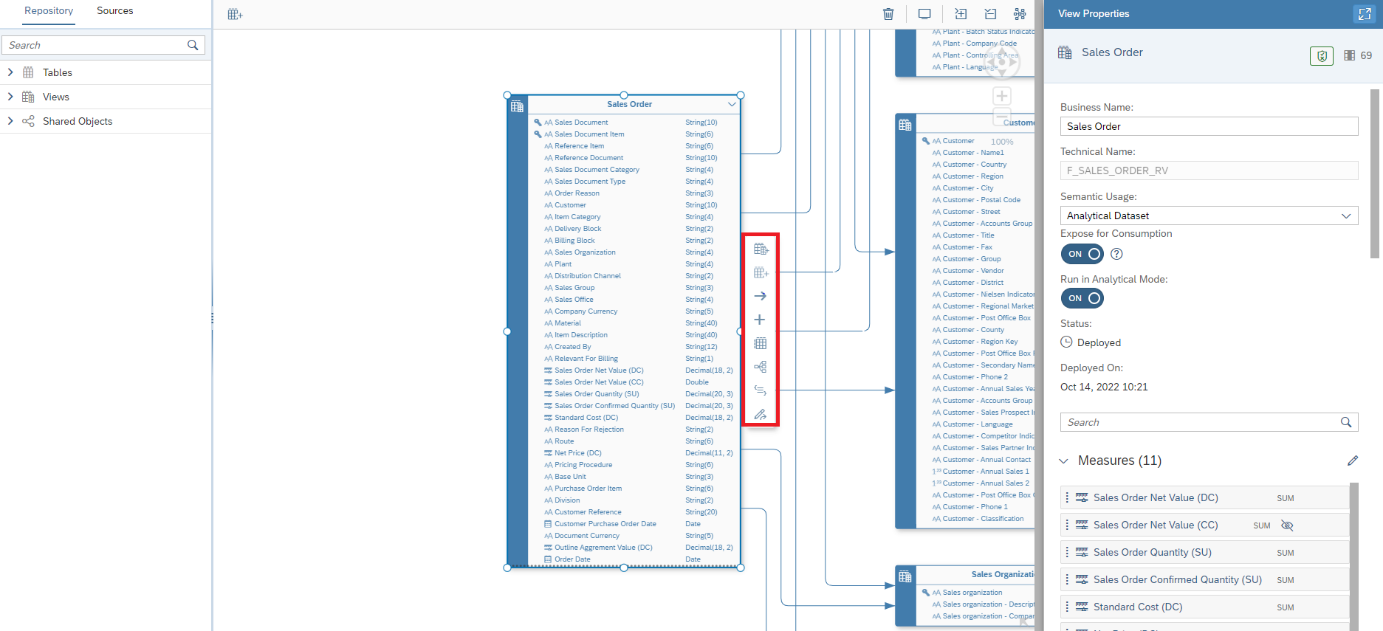
Here is an example of an E/R Model built to display an overview of the SD (Sales Distribution) universe. The red box provides editing functions (opening a view’s edit, manipulating the model’s associations); the detail pane on the right provides access to a wide range of information (metrics, attributes, associations), either about the model or the selected entity.
Tasks Chains
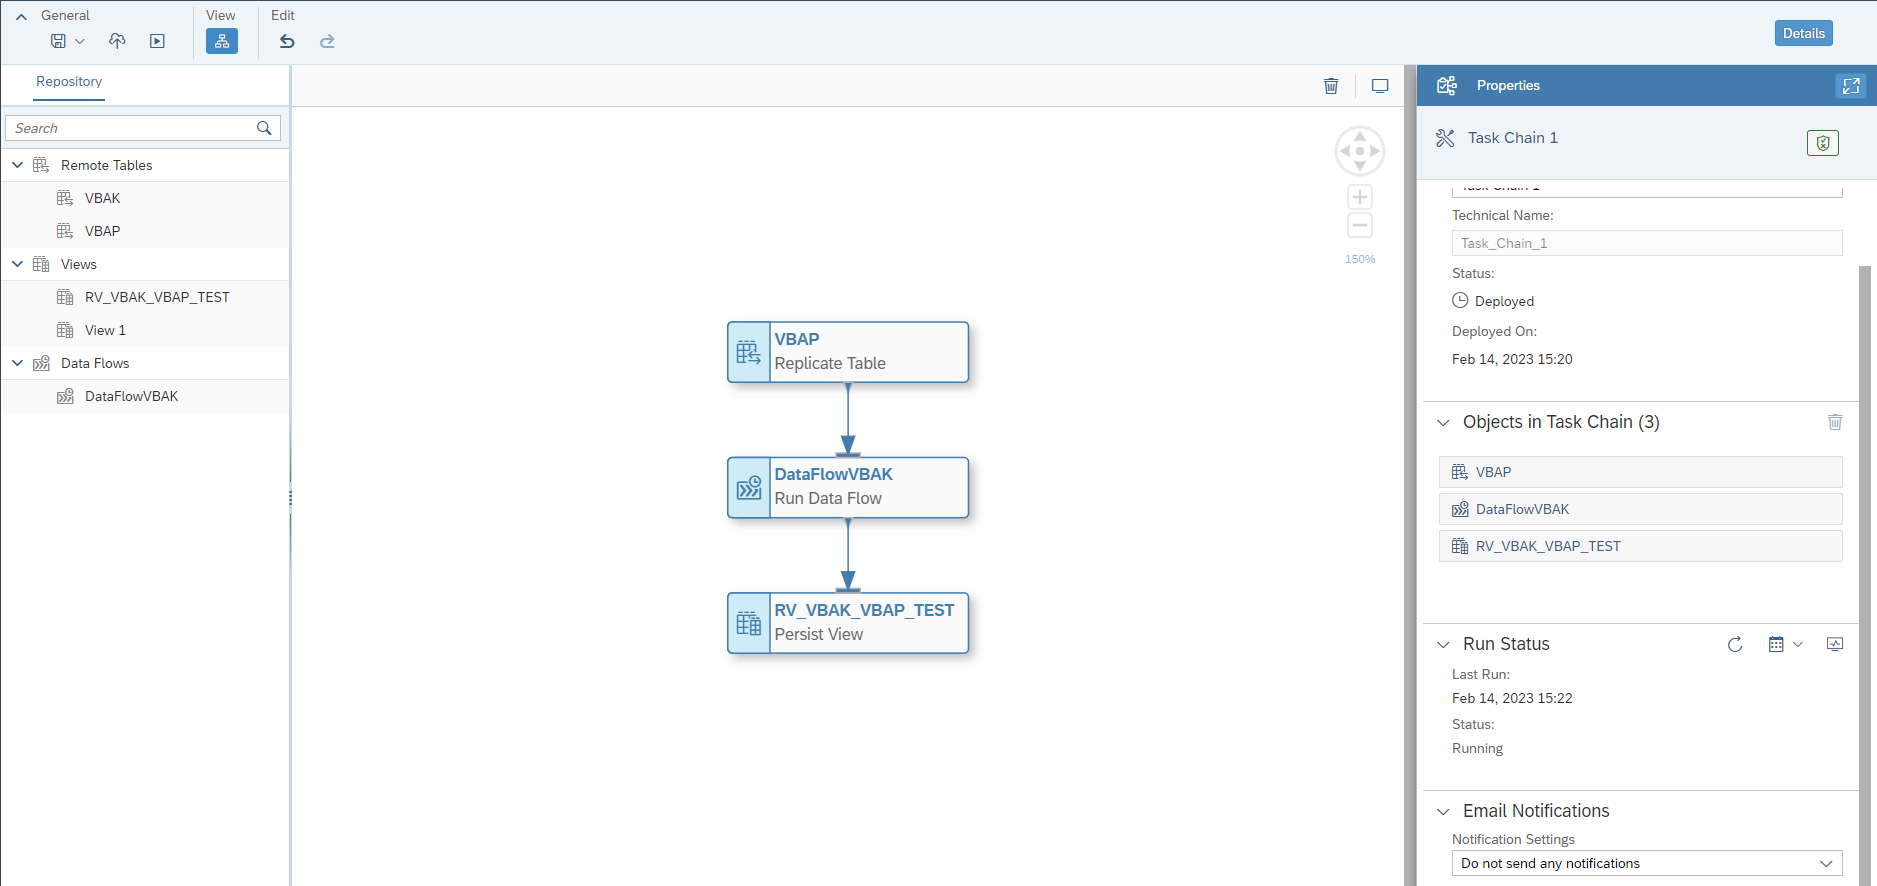
The task chain allows you to manually plan or launch the execution of several tasks in series and in an orderly fashion. This tool is very useful for organising data updates in the same space.
In a task chain, the execution tasks are automatically selected according to the type of object : replication (remote table), persistent rendering (view), execution (data flow). The user can consult the task activity.
Finally, it is possible to schedule a notification or an e-mail to be sent to users when the objects concerned have been updated. Some of the functions included in the DWC data builder allow the customisation of their content, recipients, subject…
The construction of a task chain follows the principles of drag-and-drop and is presented in the same way as the other data builder tools, with the source pane available on the left, the preview in the centre and the settings pane on the right :
Conclusion
In addition to its intuitive management, the data builder offers many advantages; the data lineage and impact analysis functionalities, overlaid with a relevant E/R model, prove to be very efficient in the organisation of data processing. SAP DWC even gives its users a choice of SQL or graphical view design for ease of use.
SAP DWC customers have an additional tool at their disposal: the Business Builder, in which it is possible to design data marts that cross-reference factual views with different dimensions in the form of a star schema.
The expert's opinion
The SAP Data Warehouse Cloud Data Builder is an excellent choice for business intelligence. Continuously enhanced by its vendor SAP, SAP DWC users have an efficient and relevant data warehouse that will meet the business needs of customers, whether they use SAP On-premise or the cloud solution.
Its compatibility with a wide range of visualisation solutions brilliantly addresses the key issues of the day. However, beware of mistakes when deploying a view: blockages are not always well explained, and a learning curve is necessary to identify the blocking points.
The RapidViews consultants nevertheless note the many intuitive, basic or advanced functionalities, which make it a good tool for managing data before it is returned to the operational departments.
